The reporting suite in Breeio provides simple, clear access to the key data that confirms learner progress, and high-impact evidence so that stakeholders outside L&D and HR can understand the big difference you make to your business.
Access to reports
Administrators and Group Managers have access to the Reporting area (Group Managers will see data for learners in their groups only). If you use Line Managers, they will have access to their team reports from their homepage.
Available reports
| Dashboard | Provides a quick snapshot of usage, completions and validity along with notifications of actions that are required. If you have saved any surveys and reports you will also find them on your Dashboard. |
| Group Aggregates | This report shows either 'validity' or 'assignment' details for all courses and all people which is then split by group categories. You can either scroll down to the next group or use the drop down menu. You can click directly into an item which will take you into the courses overview report e.g. if I wanted to look at a specific location (Cambridge) I can click on Cambridge and I would see the courses overview report for the Cambridge location only. |
| Courses overview | This report shows either 'validity' or 'assignment' details for everyone assigned to the course. You can click directly onto a course which will take you into the Course breakdown report. |
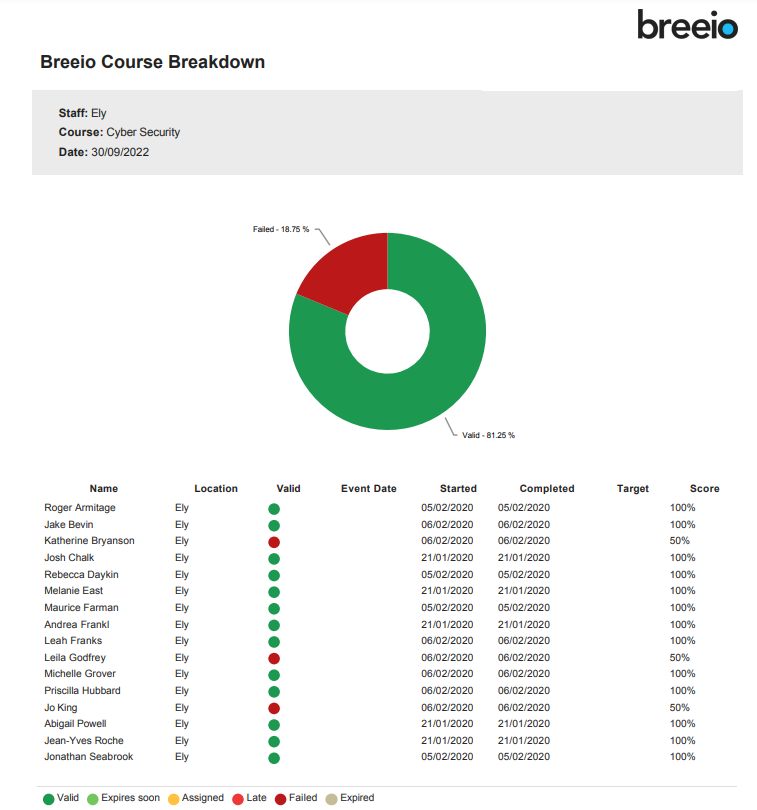
| Course breakdown | This report provides a list of all courses for you to drill down into to look at completion data. You can click on a user's name which will take you into the User overview report. The date filters work from the course assignment date. |
| User overview | This report lists all users with columns for total number of courses assigned, percentage not started, in progress, failed, passed, valid and the number of award points they have. If you want to view more information, click on the user's name to see a breakdown of course information. There are a number of actions you can do from this page - manually log training, email the user and assign training. |
| Other reports | You'll find a number of different reports and any bespoke reports in this section. |
| Learning log | A log of all training completed by all users. Central administrators can manually log training. |
| Events Forecast | This report will help you to plan when to run events and the number of seats required each month for courses that contain an Instructor-led module. |
Validity and assignment
Reports can be presented in different ways on screen - either by validity or by assignment.
Validity view shows the status of learners who need to complete a course, including those that have renewals. It is the best way of looking at your training performance if you have courses that expire and need to be renewed.
By default, validity view only displays mandatory training that isn't 'Expired, not required' and does not display Optional assignments because learners do not need to complete these courses. You can use the filters (see section below) to change the default view if you want to look at the data differently.
Assignment view shows the progress against current assignments (mandatory and optional) for the courses and learners you have selected.
Report filters
All reports can be filtered so you can set the criteria you need when generating a report.
Quick filters at the bottom of the reporting page

Filter options to drill down to a more granular level
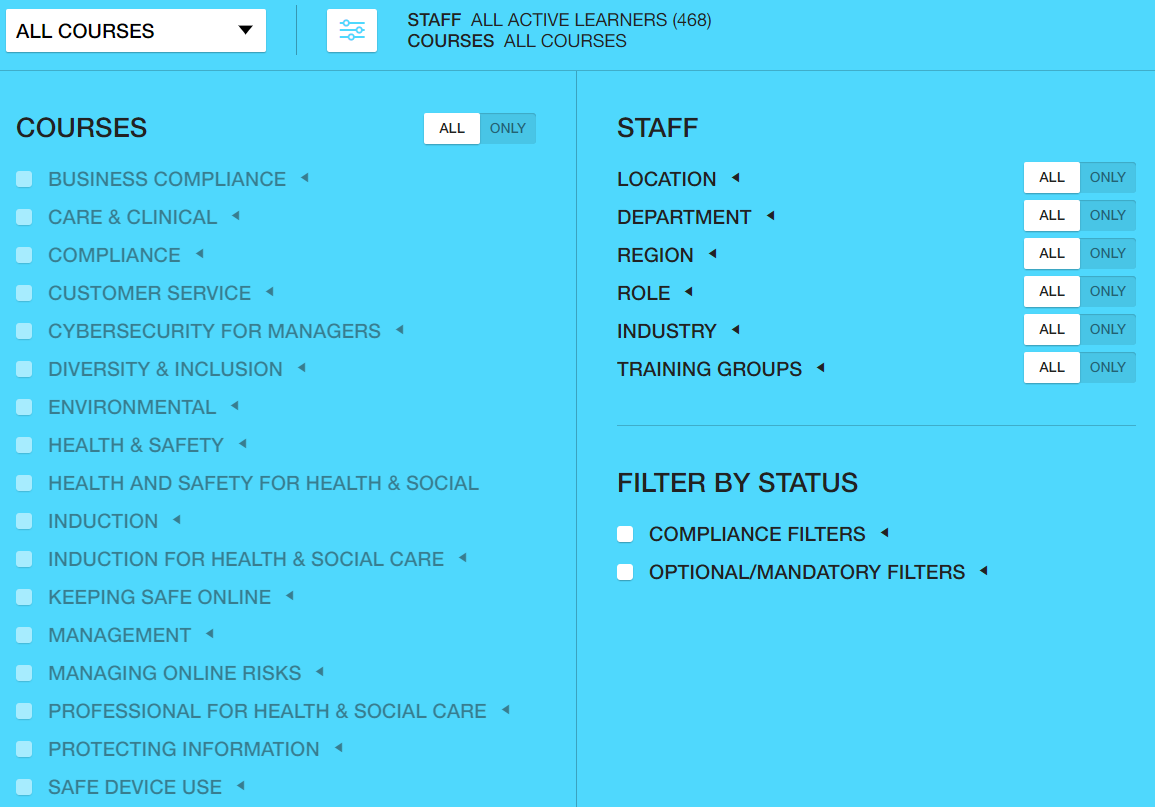
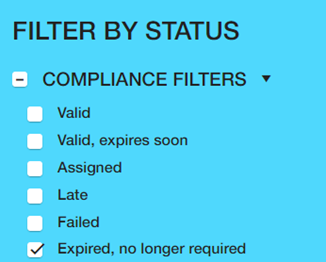
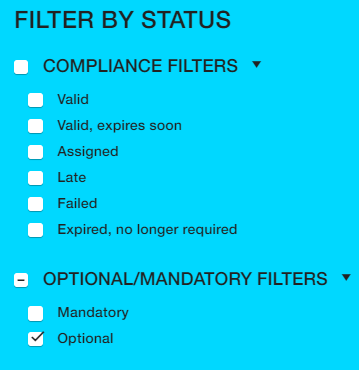
Filter by status
This provides you with compliance and optional/mandatory filters to enable you to create a report that will display the data you need to see.
As detailed above the default setting of 'validity view' will display data for assignments people need to do. If you wanted to include data for courses that learners have done but no longer need to do select the 'Expired, no longer required' option in the compliance filters.
If you want to see data for optional assignments, use the 'Optional' filter. This will present data relating to optional assignments that are In progress or have a valid completion. If you want to include data for courses that learners have done but no longer need to do select the 'Expired, no longer required' option in the compliance filters.
Saving and downloading reports
For all reports you have the ability to save or download to an Excel spreadsheet or PDF document.
When you save a report it will sit in the reports section of your Dashboard and you can schedule it to be sent to other people.
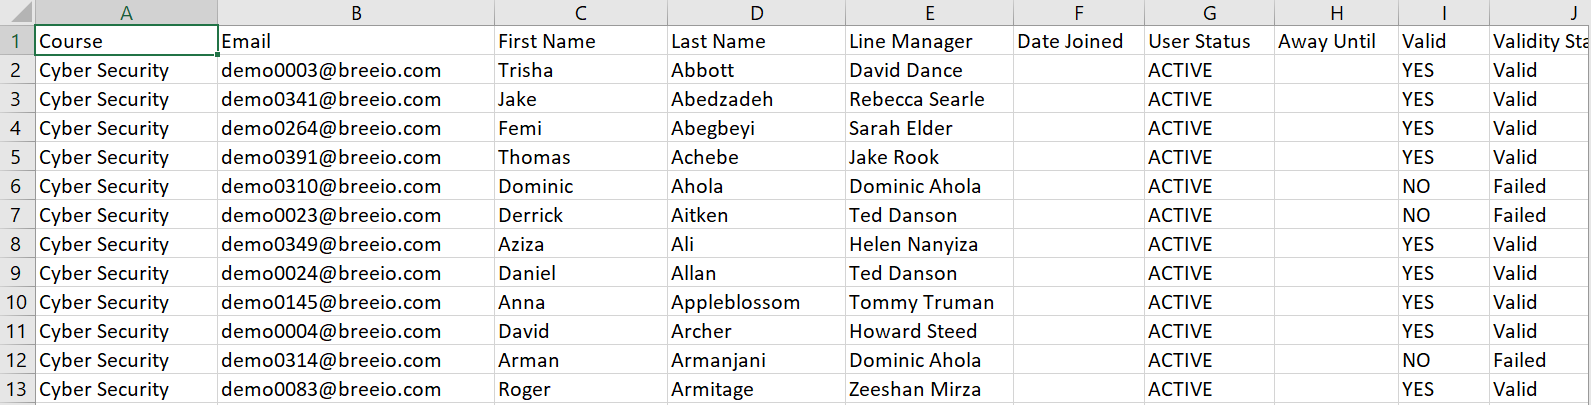
Downloading your report to Excel is great if you want to manipulate the data or merge with another internal report you might have whereas the PDF provides a snapshot of the data along with some great visuals and colour indicators.
Example of a report downloaded to an Excel file
Example of a report downloaded as a PDF
See also...