When you're in some of the reports you can set the view setting to either 'validity' or 'assignment' depending on what information you are looking to obtain from the report.
The Assignment view shows progress against current assignments (optional and mandatory) for the courses and the people you have selected.
Assignment data can be displayed in a bar chart or pie chart depending on the report:
Group Aggregate and Courses Overview reports display the data in a bar chart format
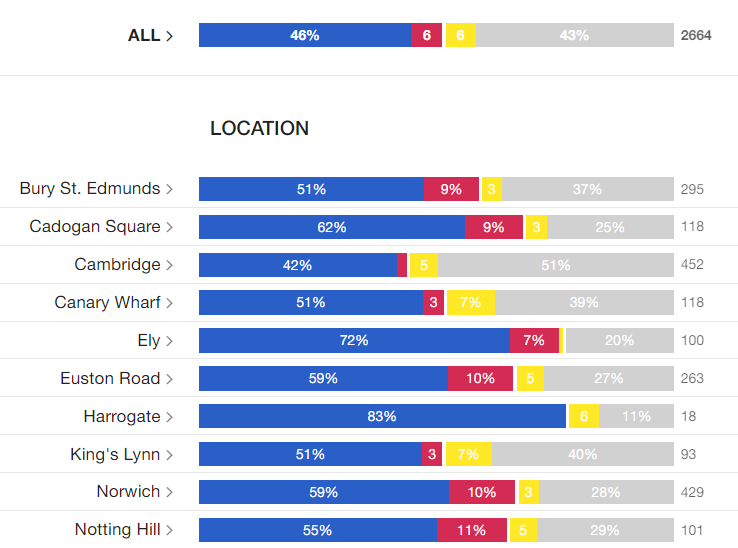
Course Breakdown and User Overview reports display the data in a pie chart format
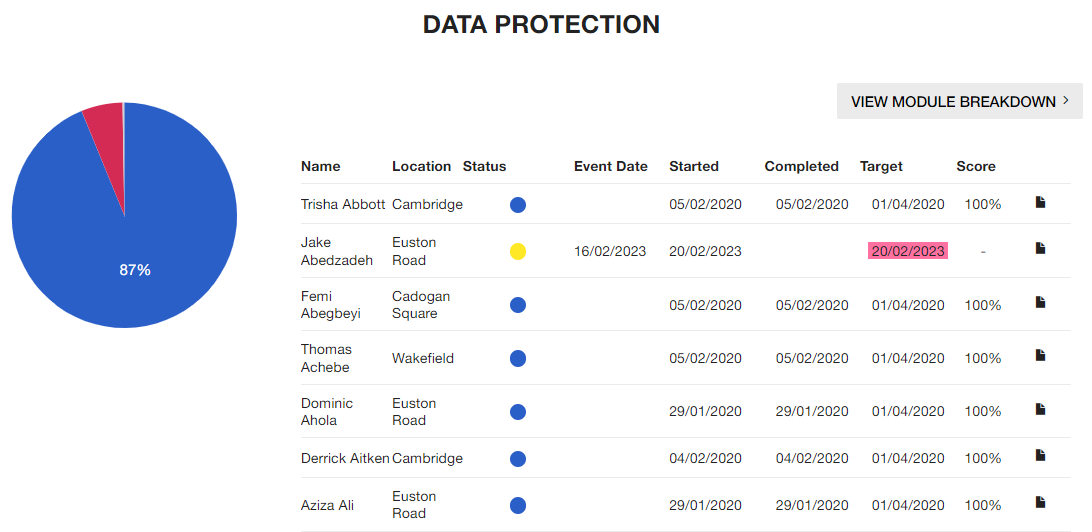
What do the colours mean?
 |
The learner has completed the course and if it has an assessment module the learner has passed it. |
 |
The learner has taken the course but has failed the assessment module. Depending on how the course has been created the learner may be able to automatically re-take the course and the assessment or the course might need to be re-assigned to them. |
 |
The learner is working through the course. |
 |
The learner hasn't started to work through the course yet. |
Remember - using the assignment view will show you data for current assignments only which is useful if you want to check the progress being made on a course that does not have a validity period. It will let you know if you need to check in on learners and action you might need to take e.g. speak with those who have failed to see if they need further support.
When to select the validity view over the assignment view?
Choose the validity view when you have a course that has a validity period and you want to view if they are still valid (e.g. complaint) on the course. When validity approaches expiration and the course is automatically reassigned, it will show in assignment view as a new 'not started' assignment but the course is still valid at that point which you would see under validity view.
See also...