The Dashboard is split into four areas to provide you with a quick snapshot of what is happening in Breeio.
1) Notifications
This area provides you with some headlines of what happened overnight and what actions need to be taken.

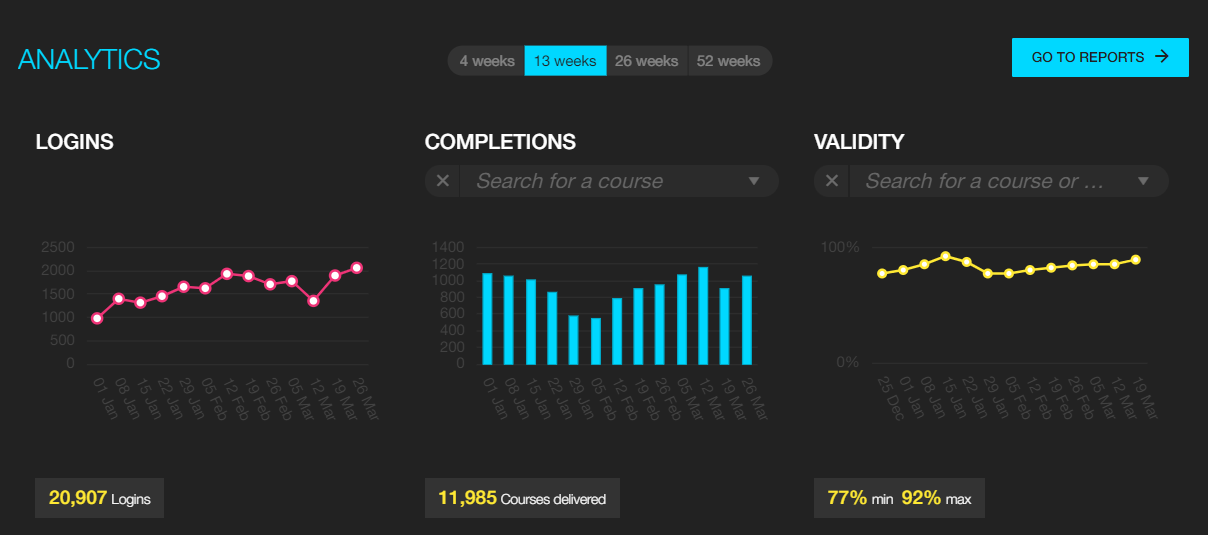
2) Analytics
This area provides you with some great visuals to get a snapshot of activity on your account.
The Central Administration Team - see the data for the whole organisation
Group Managers - see the data for their group only
You can change the view of the graphs by changing the number of weeks of data and searching for a course under completion and validity.
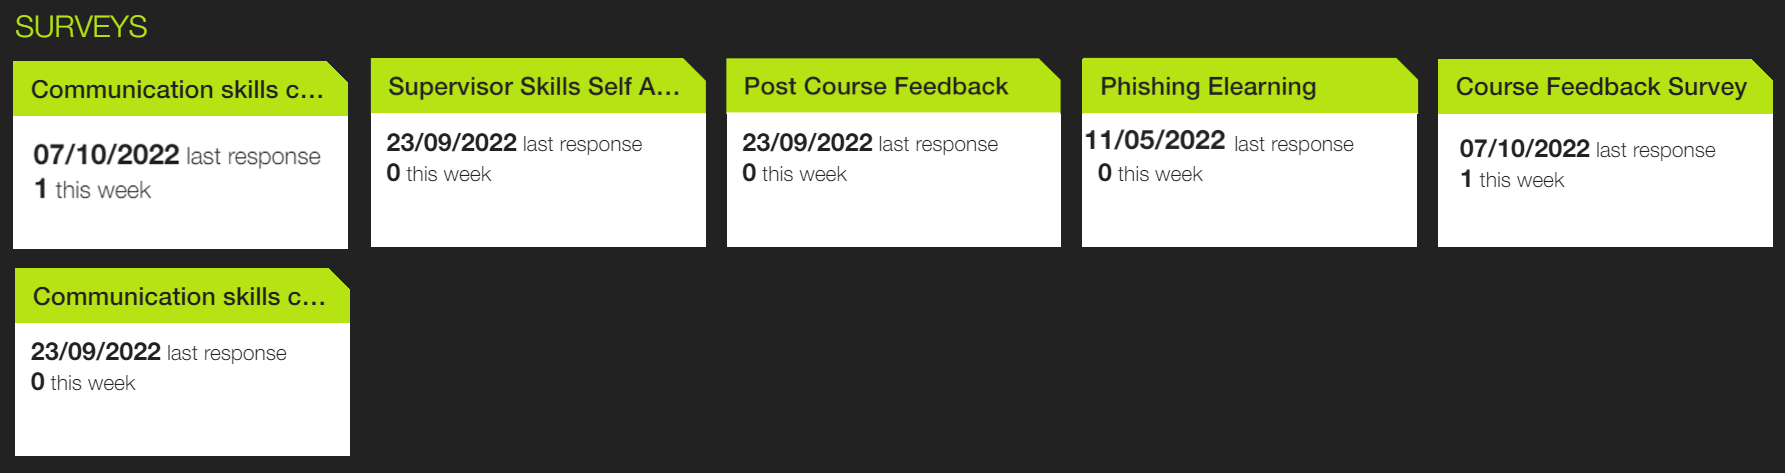
3) Surveys
A survey tile will appear on your dashboard once one learner has completed it. It updates to let you know the number completed in the last week and keeps a date stamp of the last response.
Simply click on the survey tile to take you straight into the survey results.
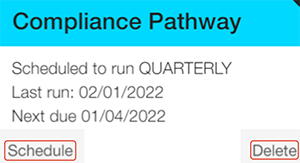
4) Saved reports
For reports you use regularly, you can save it onto your dashboard so you can access it quickly by clicking on the report tile. Reports that you have scheduled are easily identified on the tile and you can schedule or delete the report from the dashboard by hovering over the tile and clicking on the button.
See also...